5 Experiments
In this section, we validate the theoretical insights through practical experiments.
We implemented and trained from scratch four models on the MNIST dataset:
- AutoEncoder (AE)
- Variational AutoEncoder (VAE)
- Variational Sparse Coding (VSC)
- Variational Sparse Coding with Warm-Up (VSC-WU)
All models share the same encoder/decoder structure: three convolutional layers with ReLU activations, ensuring a fair comparison by keeping the number of parameters approximately equal. Each model was trained using the Adam optimizer over 25 epochs.
5.1 Latent Space
5.1.1 Visualization
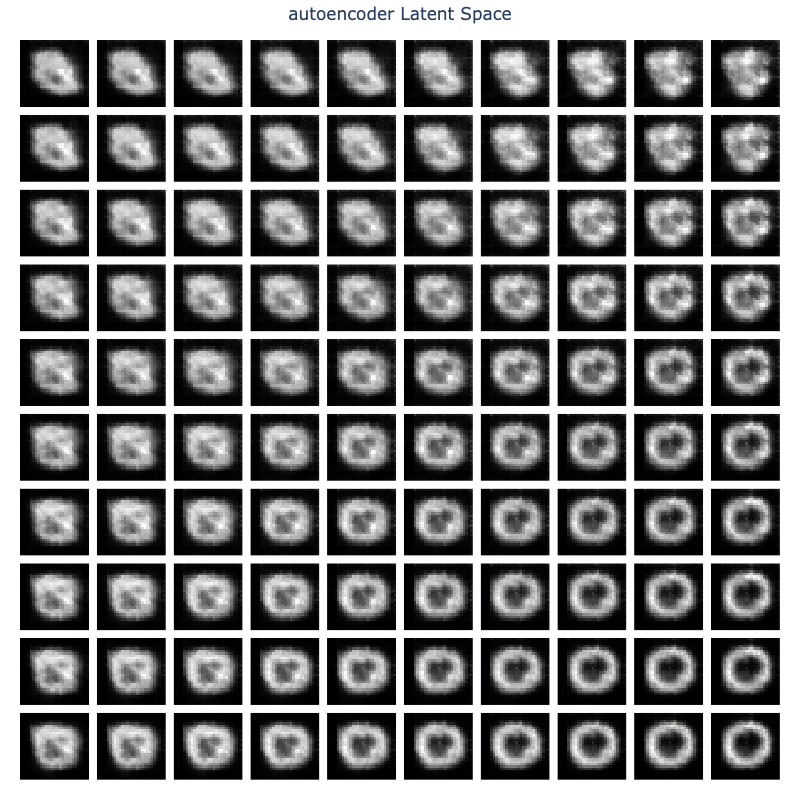
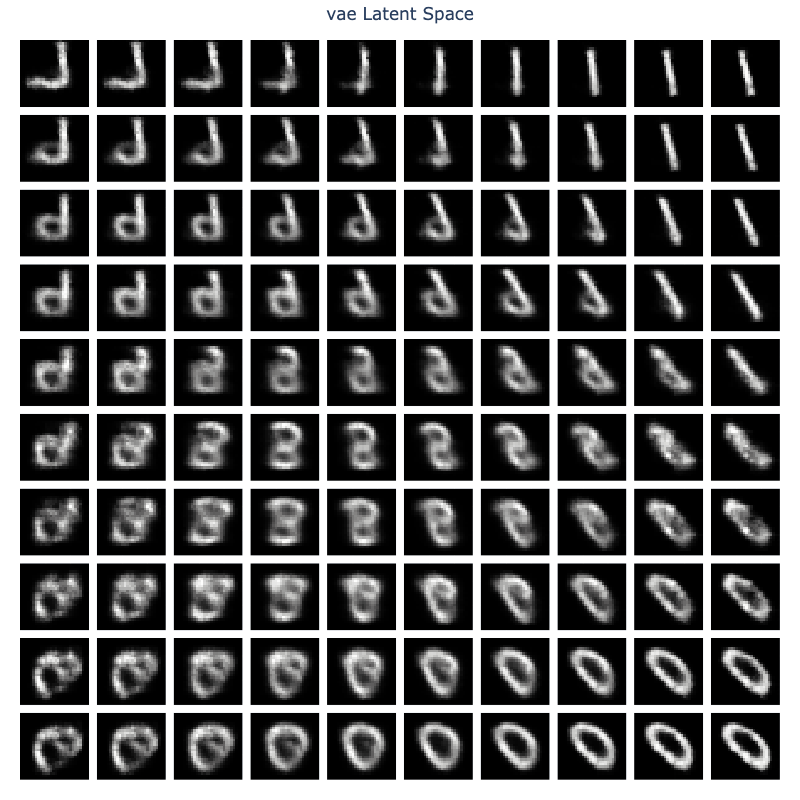
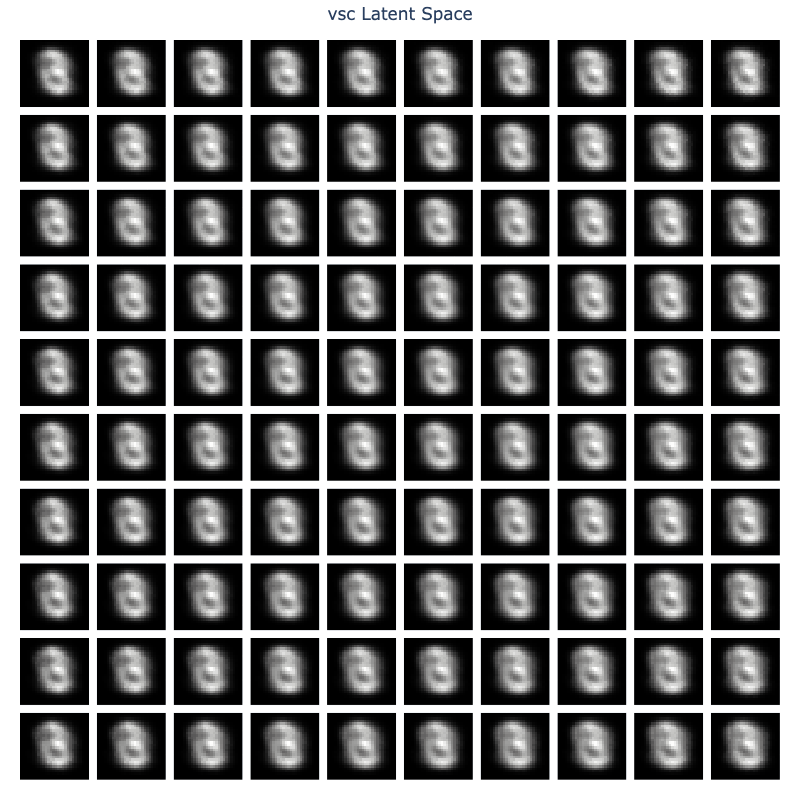
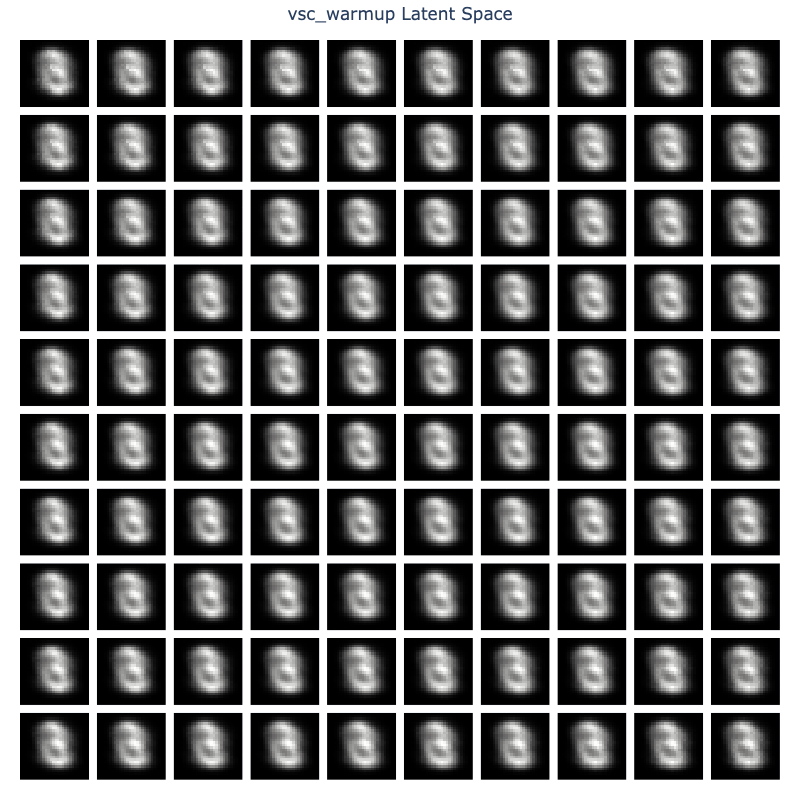
To qualitatively evaluate the structure of the latent space, we sample from a 2D grid of latent vectors and each point is decoded to an image
This provides insight into how the model organizes information in the latent space.
5.1.2 Interpretation
AE: Exhibits minimal structure, with random digit distribution and no discernible clustering.
VAE: Better organized and gradual transitions between digits.
VSC: Should reveal discrete clusters for each digit class but we don’t see distinct boundaries like expected with the sparse coding framework.
VSC-WU: Should show improved transition smoothness between clusters.
5.2 Activated Dimensions
5.2.1 Visualization
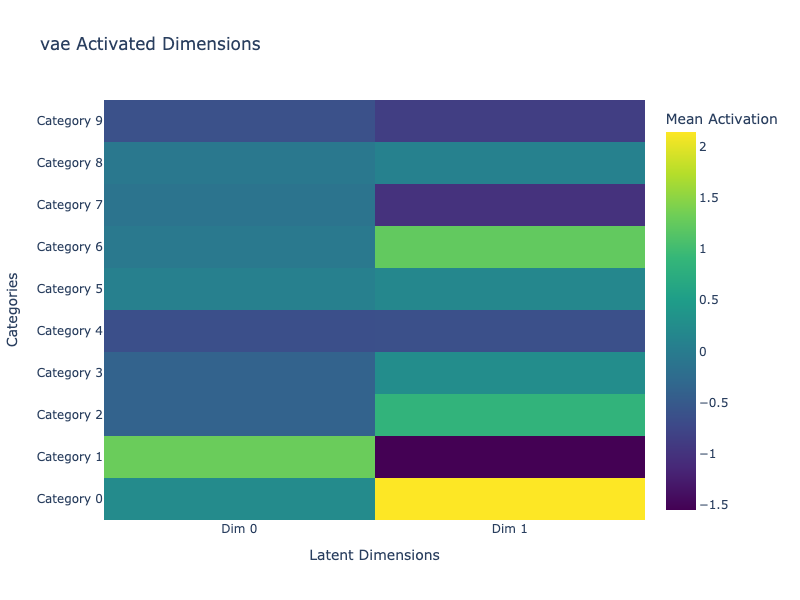
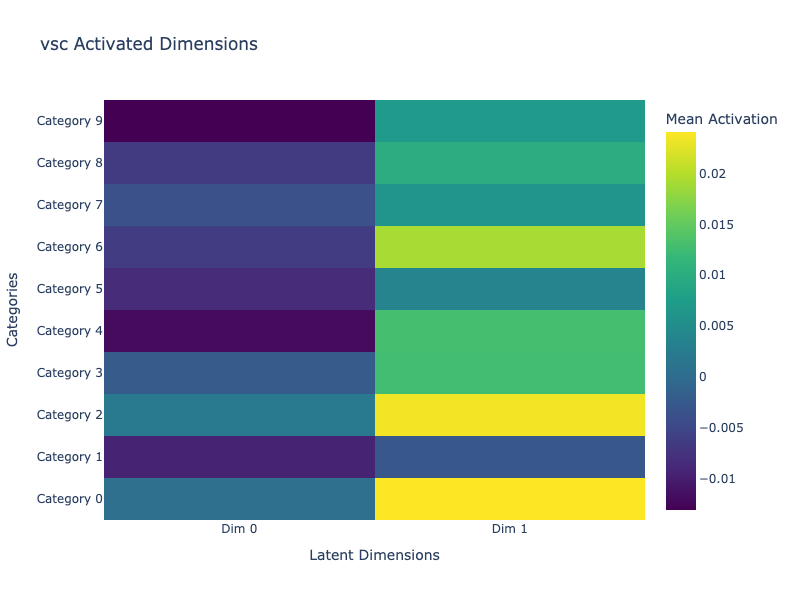
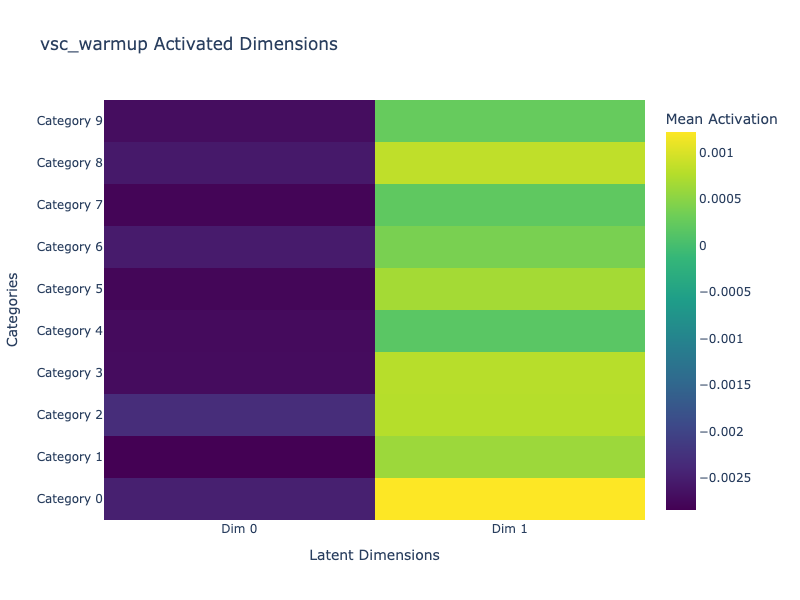
We visualize how each latent dimension is activated across the dataset categories. For each class (0 to 9), we compute the mean latent vector and display it as a heatmap.
This helps us identify how interpretable and sparse the representations are.
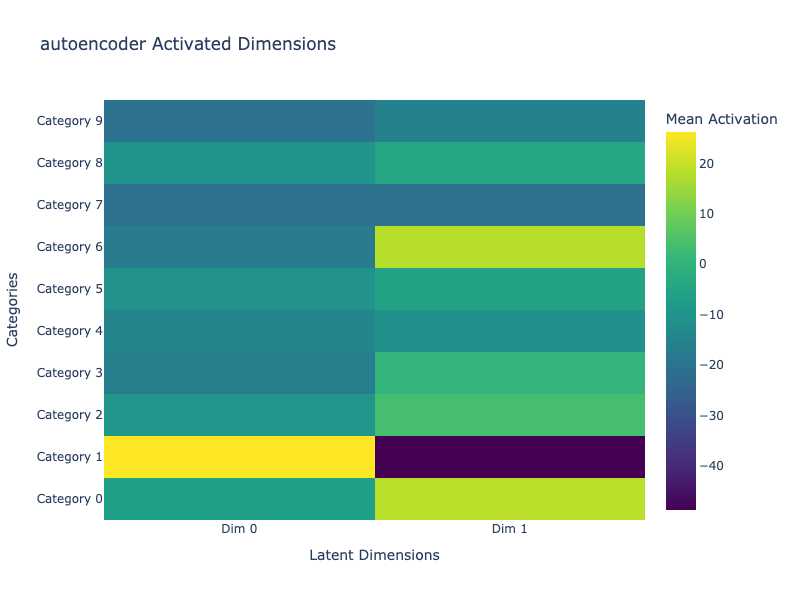
5.2.2 Interpretation
AE: Shows dense activations across all dimensions, indicating non-selective feature encoding.
VAE: More balanced but still overlapping activations. No clear sparsity pattern.
VSC: Demonstrates clear sparsity. The two dimensions remain near zero, and not the same are selectively active depending on digits. This aligns with the spike-and-slab prior’s goal of feature disentanglement. More latent dimensions could help demonstrate posterior collapse. Note: During our experiments, we didn’t find the authors’ tuning that prevented collapse with spike values ≠ 1.0
VSC-WU: Same as for VSC but with lower and more homogeonous values. More latent dimensions could help demonstrate that the warp-up strategy helps to avoid posterior collapse but it is not obvious here.
5.3 Reconstruction
5.3.1 Visualization
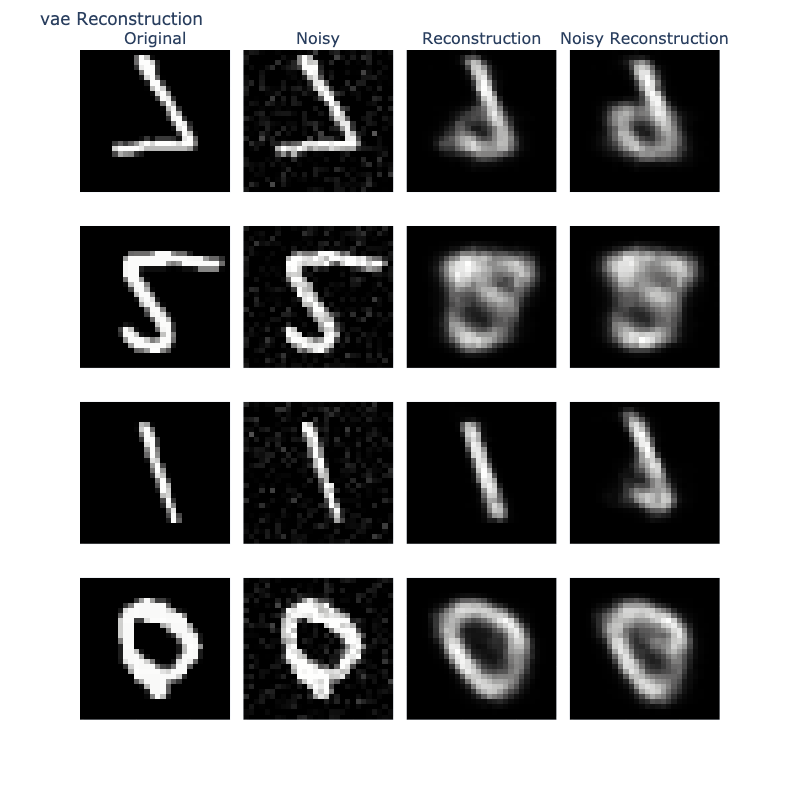
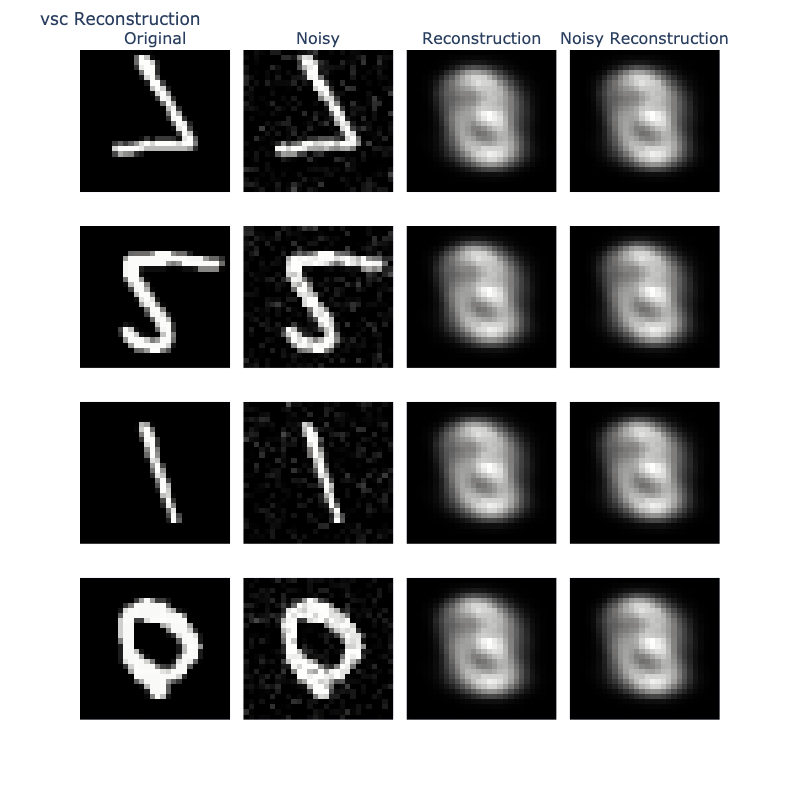
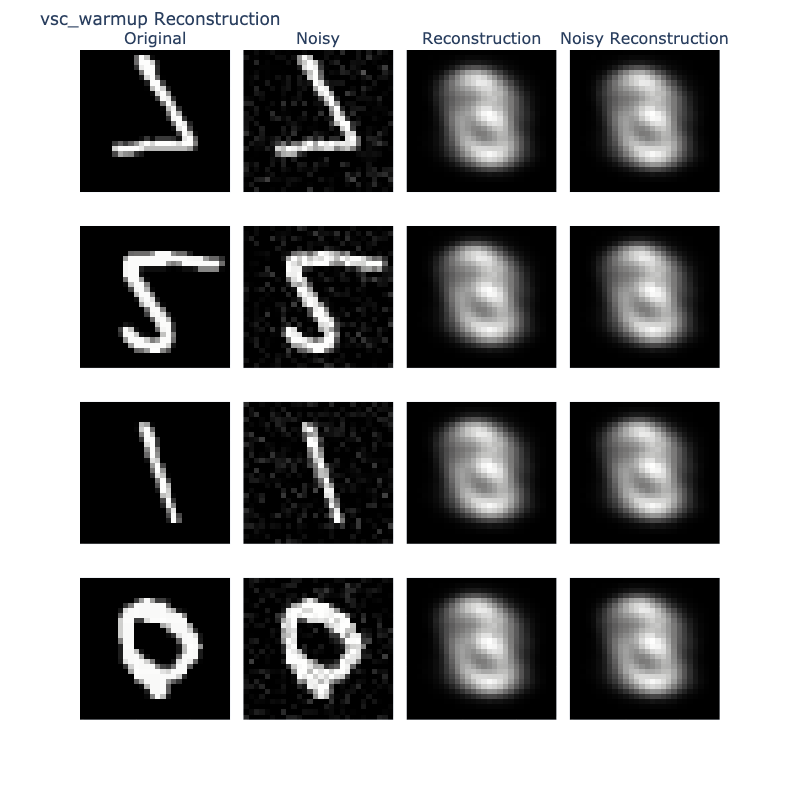
Finally, we evaluate reconstruction quality by comparing recontructions of original and noisy images.
This assesses both reconstruction quality and robustness to perturbations.
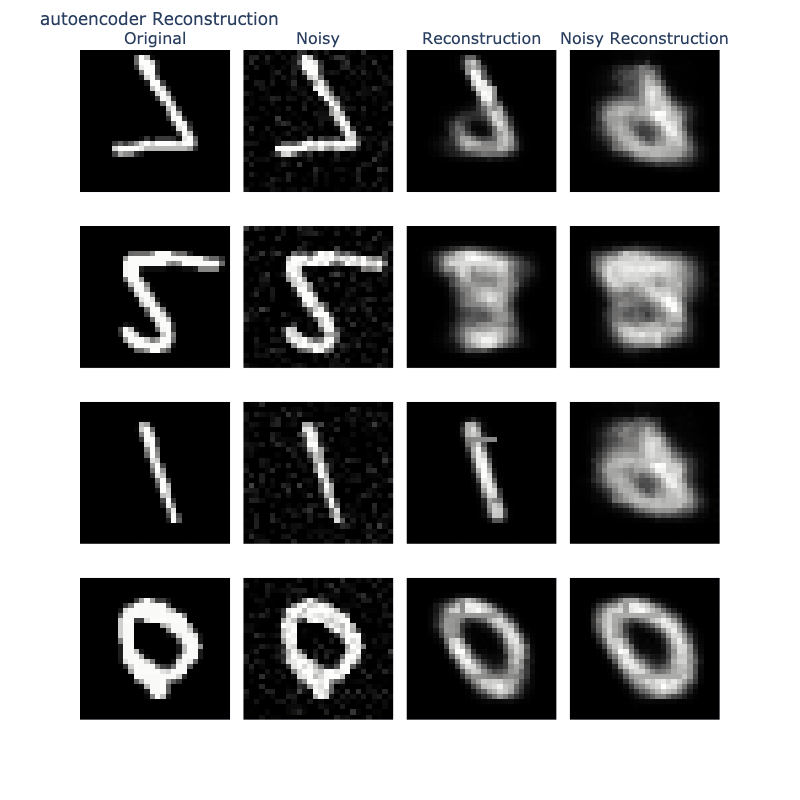
5.3.2 Interpretation
AE: Generates sharp reconstructions but fails to denoise effectively.
VAE: Produces more robust reconstructions with partial noise suppression.
VSC: Low quality reconstructions.
VSC-WU: Low quality reconstructions.